Our previous post in this series on the arrival of spring highlighted how the leaf-out date (the date when plants’ first leaves emerged) for common garden plants—lilac and honeysuckle—showed a lot of variation across the eastern United States. The map resembles a layer cake, with alternating bands of color: purple where leaf-out came later than average, and orange where leaf-out came earlier. The timing was linked to regional weather events that chilled some areas and warmed others.
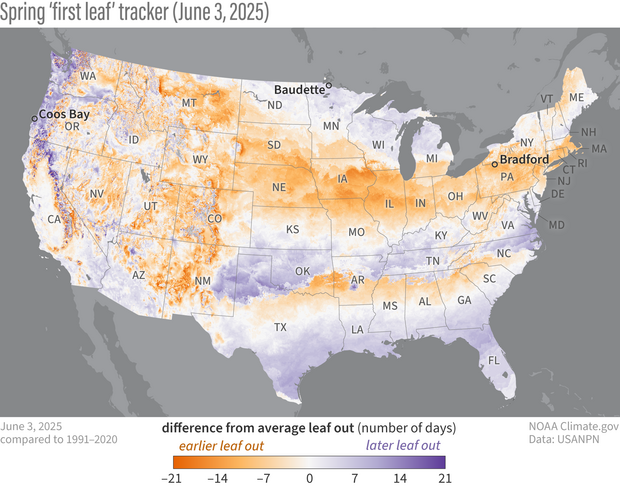
Date of first leaf of the 2025 spring season compared to the long-term average. Orange shows places where the first leaf of lilacs and honeysuckle emerged earlier than average; purple shows places where leaves were later than average. NOAA Climate.gov map, based on leaf index data through June 3 from the U.S. National Phenology Network.
Another indicator of the arrival of spring that scientists and gardeners have been tracking for many decades is the first bloom date. Beyond our own enjoyment, the blooming of flowers is an important seasonal milestone for insects and other pollinators, which depend on pollen or nectar for food. It’s also of great importance to farmers and other agricultural producers.

The emergence of the first flowers of the season is an important milestone for insects and other pollinators. Photo by Gabriel Lässer via Pixabay.
For example, if warm winters or springs cause early flowering in peach or other fruit trees, it can make them especially vulnerable to damage from a single late-season frost or freeze. Likewise, if migratory birds like the ruby-throated hummingbirds arrive in their summer breeding grounds and find their nectar sources unavailable—because flowers have already bloomed or are late to bloom—it can negatively affect survival and breeding success.
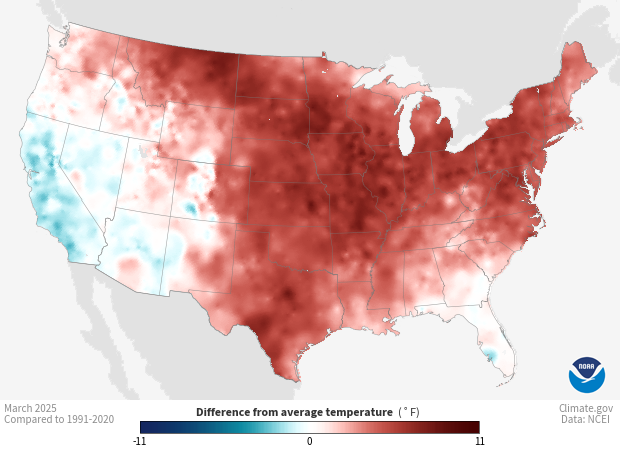
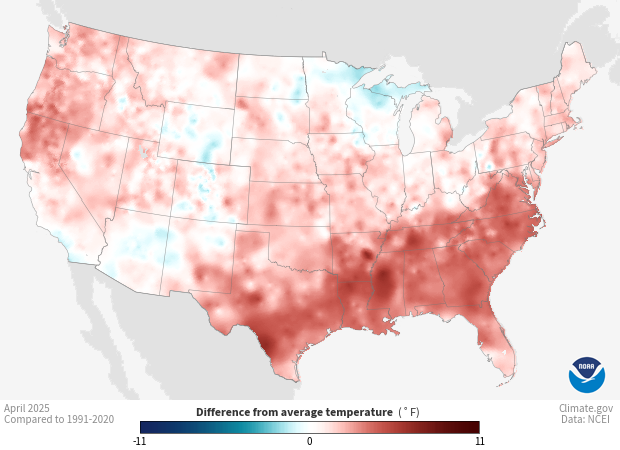
Compared to leaf emergence, the arrival of the first blooms of 2025 were more consistent across the country, with most areas seeing earlier-than-average emergence of these plants’ first flowers of the season. This early flowering is consistent with the warmer-than-average March and April experienced across most of the contiguous United States.

Date of first bloom of the 2025 spring season compared to the long-term average. Darkest pink shows places where blooms emerged two weeks or more earlier than average; darkest green shows places where blooms were up to two weeks or more later than average. Gray areas in the West are high mountains where blooms had not yet emerged as of June 2. NOAA Climate.gov map, based on bloom index data from the U.S. National Phenology Network.
Although most of the country saw earlier-than-normal first blooms, a few areas did see their first blooms emerge later than normal, including California’s northern coastal mountains, and parts of Texas, Florida, and the coastal Carolinas. In contrast, a broad west-to-east swath of much earlier than average blooms (dark pink) occurred in the eastern part of the country, merging with an area of very early blooms that follows the Appalachian Mountains from North Carolina to West Virginia.
The patchy appearance of the western half of the country is a result of the area’s diverse topography—mountains, mesas, desert basins, and canyons. That variation creates numerous microclimates within relatively small areas. Those microclimates can result in patterns like those in northwest Arizona: pockets of early flowering right next to pockets of late flowering.
Leaves and blooms are not always in sync
If you compare this year’s map of first leaf to first bloom, you see many places where these two indicators of spring were in sync, meaning first leaves and blooms were both early, or were both late. Places that followed this pattern included Bradford, Pennsylvania (both leaves and blooms were early) and Coos Bay, Oregon (both leaves and blooms were late).

This pair of line graphs shows how average daily temperature at two locations influenced leaf and bloom timing in similar ways this spring. In Bradford, Pennsylvania, (top) both March and April had many days with well above average temperatures, leading to leaf-out coming 10 days earlier than average and flowering 8 days earlier than average. In coastal Oregon (bottom), temperatures were mostly below average in February and March, and both leaves and flowers appeared a couple of days later than average. NOAA Climate.gov graph, based on data from NOAA Northeast Regional Climate Center and the U.S. National Phenology Network.
Less common were areas where first leaves were late, but first blooms were early. One example of this was in Baudette, Minnesota, and areas to its east around the Great Lakes. There, cooler-than-average temperatures in mid-March may have contributed to a 5-day delay in the emergence of plants’ first leaves. But a warmer-than-average April ultimately brought out flowers 6 days earlier than average.

This line graph shows how daily temperatures in Baudette, Minnesota, were below average on many days in mid-March, contributing to a 5-day delay in the emergence of the season's first leaves. But a significant warm up in April brought flowers out 6 days early. NOAA Climate.gov graph, based on data from NOAA Northeast Regional Climate Center and the U.S. National Phenology Network.
What was extremely rare this spring—so rare that we couldn’t find a good example just by visually comparing the two maps—was the combination of early leaves, but late blooms. While it isn’t necessarily true every year, it seems that this year, once a location had experienced enough warmth to trigger early leaf out, it was unlikely to experience enough of a cold snap to slow down the emergence of the plants’ first blooms. If you’d like to try to find this combination of conditions yourself, you can compare the maps using the slider below or explore the underlying data with the U.S. National Phenology Network’s interactive data explorer. If you find an example, be sure to share it with us on one of our social media channels!


Grab and drag slider to compare leaf-out anomalies (days earlier or later than average) to first-flower anomalies in spring 2025. It's pretty easy to find places where leaves and flowers were both early—as in Bradford, Pennsylvania—or were both late, as in Coos Bay, Oregon. And there were at least a few places like Baudette, Minnesota, where leaves were late, but flowers emerged early. But we couldn't find any good examples of the opposite: early leaves, but late flowers. NOAA Climate.gov maps, based on data from the U.S. National Phenology Network.
Effects of climate change on plant milestones
As these maps show, the timing of seasonal plant milestones like leaf out and first bloom are influenced by seasonal climate and weather. But what about the effects of long-term climate change? Are these phenological milestones changing across the United States over the long-term? Stay tuned for our final post in this series to learn more!